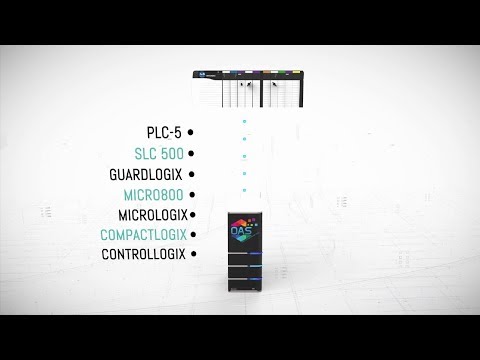
Which Allen Bradley Controllers are Supported?
The OAS Platform supports a wide range of Allen-Bradley controllers across both modern Logix platforms and legacy Rockwell Automation PLC families. This allows organizations to integrate historical data logging across mixed automation environments without requiring controller upgrades.
Logix Controller Family:
- ControlLogix
- CompactLogix
- GuardLogix
- Micro800
Classic Allen-Bradley Controllers:
- MicroLogix
- SLC 500
- PLC-5
Which Open Databases Can Be Used for Data Logging?
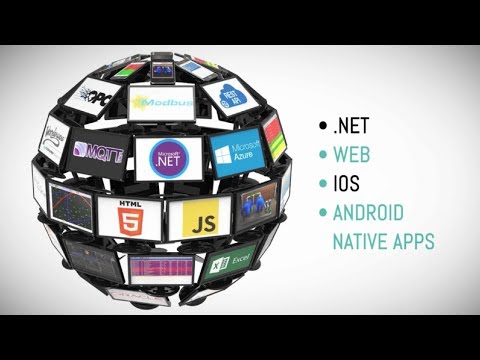
PLC data collected by the OAS Platform can be stored in a wide variety of relational, cloud, and open-source databases. Organizations can integrate industrial data directly into enterprise reporting systems, business intelligence tools, and custom analytics applications.
Enterprise SQL Databases
- Microsoft SQL Server
- Oracle
- PostgreSQL
Cloud Database Platforms
- Azure SQL
Open Source Databases
- MySQL
- MariaDB
- MongoDB
- Cassandra
File-Based Logging
- CSV files
- SQLite
- Microsoft Access
OAS Components Used
This example Use Case utilizes the following OAS Platform Components and can be deployed in many different configurations to achieve the best performance and reliability:
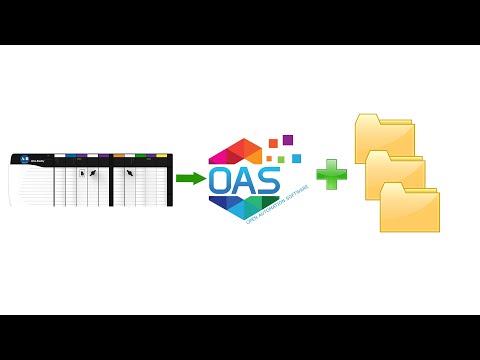
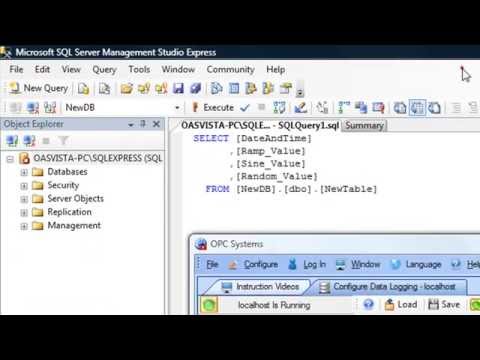
How is Allen-Bradley PLC data logged to an open database?
Allen Bradley PLCs connect directly to the OAS Universal Data Connector using the native Allen-Bradley communication driver. PLC values are mapped to OAS Tags, which are then configured within the OAS Data Historian to log historical records into database tables at defined intervals, triggers, or event conditions.
Step 1: Connect to the PLC
Allen-Bradley controllers are connected directly to the OAS Universal Data Connector using the Allen-Bradley Connector. Direct connectivity enables high-speed communication and full support for native controller features.
Step 2: Map PLC Values to Tags
PLC variables and data points are mapped to Tags within the OAS service. Tags act as the central data model used across the entire OAS Platform.
Once created, Tags can be accessed by:
- the Data Historian
- dashboards and visualization systems
- external applications
- reporting and analytics tools
Step 3: Configure Historian Logging
Using the OAS Data Historian, Tags are mapped to database tables and fields. Logging groups define how and when data is written to the database.
Logging groups can be configured with:
- custom intervals
- event triggers
- change detection
- scheduled logging
The system supports unlimited logging groups and database targets, allowing different datasets to be logged under different conditions.
When deploying an enterprise logging solution with the OAS Platform where multiple physical locations are involved, you can also choose to deploy an instance of the OAS Universal Data Connector on each location’s network, ensuring all data points are capture, buffered, and logged even when network connections to the enterprise are down.
In distributed industrial environments, OAS services can be deployed locally at each facility to capture and buffer PLC data. If connectivity to the central enterprise network is interrupted, data continues to be collected locally and is automatically forwarded once the connection is restored.
Data Historian Features
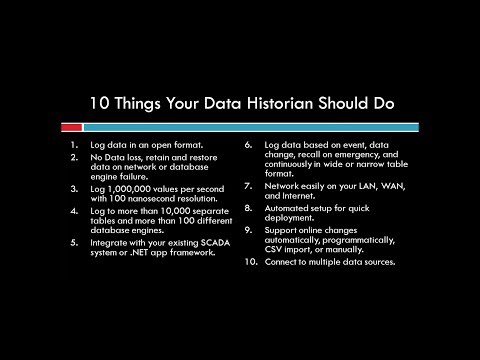
Data Logging Types:
- Continuous: Log continuously as fast as 100 nanoseconds.
- Event Driven: Log one record based on trigger.
- Data Change: Log a record for each value change.
- Snapshot: Go back in time to record data prior to an event.
- Time of Day: Log one record at a specific time each day.
Store and Forward:
No data loss on network failure or database fault.
100 Nanosecond Resolution:
Unique data handling of data from controller buffer to record values as fast as the controller can process values.
Open Format:
Data is logged to databases in an open format to access directly from any third party reporting system.
Log data to SQL Server, Oracle, Access, mySQL, Azure SQL, PostgreSQL, Cassandra, MongoDB, MariaDB, SQLite, and CSV files.
Automated Setup:
Utilize One Click Allen Bradley together with One Click Database to automatically setup logging of all data from the controller. Or utilize programmatic setup of Tags and Data Logging with a .NET application.
FAQ Section
What is a data historian?
A data historian is a specialized system designed to capture, store, and retrieve time-series data from industrial equipment such as PLCs, sensors, and control systems. Historians allow engineers to analyze machine performance, troubleshoot issues, and generate long-term operational reports.
What is the difference between SCADA and a historian?
SCADA systems focus on real-time monitoring and control of industrial equipment, while data historians focus on storing historical data for long-term analysis. Many industrial architectures use both systems together, with SCADA providing live visualization and historians providing long-term data storage.
What is a PLC historian?
A PLC historian is a system that records operational values from programmable logic controllers over time. These values are stored in a database and used for reporting, diagnostics, compliance tracking, and performance analysis.